When it comes down to SQL Server I will always be curious. Curious as to what these methods/functions are, how they work, why they work the way they do, and how I can better utilize these methods/functions. SQL Server has so many different functions that it almost seems impossible to get through them all due to it being such a powerhouse of a program. So yesterday I was in search of a new button to click and found the “Include Client Statistics” button. Having no idea what exactly client statistics are I decided to click on it and see what it would do and boy was I amazed! This little tool is absolute magic!
Essentially, the Client Statistics tool will display grouped information about the query that you are running. Although this is not as robust as the Actual Execution Plan, which shows how your query can be improved the most, the Client Statistics gives you information that you would probably need to memorize/keep track of on a sticky note as you write your query. Let me show you what I mean:
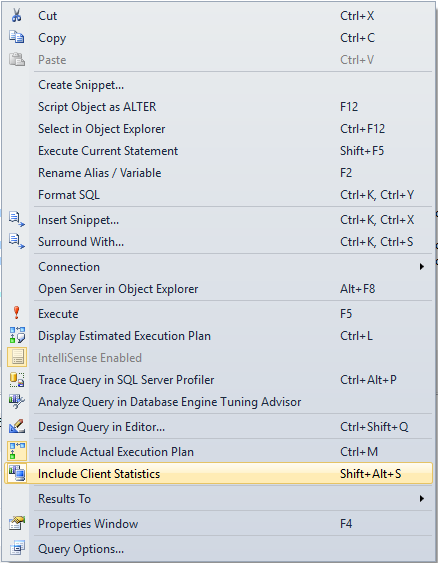
Activate Client Statistics by using either the button in the SQL Editor Toolbar or by right-clicking and selecting “Include Client Statistics” from the drop-down menu.
Toolbar:

Menu:
From here write your query and execute it. You will then receive the following output tab with similar information.
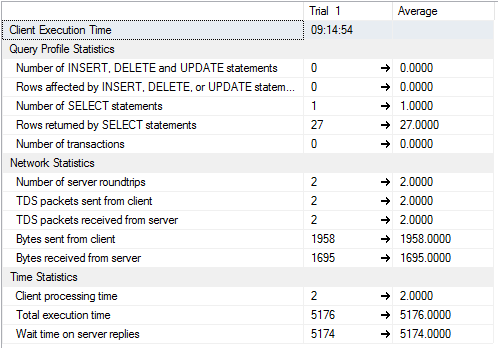
There is some extremely valuable information that’s given here such as the number of SELECT, INSERT, UPDATE, and DELETE statements. You can see how many transactions were initiated, the number of rows returned, and the processing/execution time. The Network Statistics inform you as to how much traffic is moving from your client to the server and back. The Time Statistics will tell you how much time was spent processing from the client and how long the request spent waiting for the server (all in milliseconds).
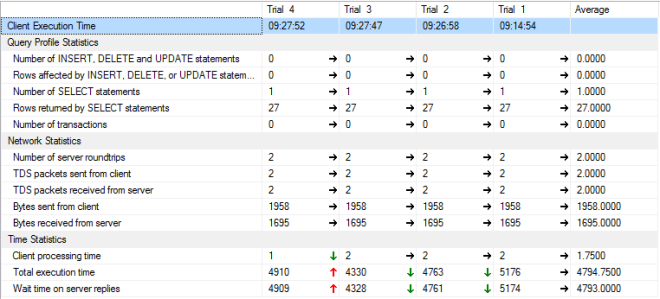
This tool can be very useful just after one run but, just as things usually get better with time, using multiple runs during your query tuning can be even better. The statistics will be shown for up to 10 executions which SQL Server names “Trial #” and will average them all together in the end. Therefore, as you make changes to your query you are able to see the performance changes at a glance, they even come with colored arrows (green for an increase in performance and red for a decrease in performance)! This is shown below.
There’s a ton to keep an eye out for in SQL Server. Just as my friend and VP of IT says, “It’s just one giant toolbox holding the tools you need to get the job done and you can’t do a thing until you know a thing.” So keep an eye out for new things and don’t hesitate to learn them as you go. It’ll only bring you one step closer to being a SQL god.
